The Nationwide House Price Index has reported that month-on-month house prices increased. In the face of dire predictions of a housing market crash, the latest data for October comes as a surprise to many. In a twist that defies expectations, UK house prices saw a notable 0.9% monthly increase. This latest data suggests there the housing market no longer going to crash and that house prices are not falling but rising.
The Nationwide HPI reported that the average UK house prices rose by 0.9% month on month in October. However, the Nationwide HPI needs to be carefully examined. Otherwise both buyers and sellers could be inadvertently mislead about the direction of UK House Prices. The is no doubt that House prices are falling and this article will examine why. Despite this recent evidence I still think the housing market is going to crash.
Disclaimer: This is not financial advice and you are responsible for your own financial decisions. I am not a mortgage broker or advisor and I don’t give financial advice! Please consult professional advice before making any kind of mortgage decision.
Nationwide House Price Index
According to the Nationwide, in October, UK house prices experienced a 0.9% increase compared to the previous month. While this marks an improvement in the annual rate of house price growth, it still remains at -3.3%, lower than the same month in the previous year, which saw a -5.3% change. Based on the Nationwide HPI it would seem that these minimal falls and that the housing market is not going to crash.
Housing market activity continues to be weak, with fewer mortgages approved for house purchases. The rise in house prices can be attributed to constrained property supply and stable labour market conditions, as there’s little evidence of forced selling or downward pressure on prices. However, the market is expected to remain subdued in the near term due to affordability issues, despite modest improvements in income, lower house prices, and mortgage rates.
The UK housing market saw a 0.9% monthly increase in house prices in October, leading to a yearly growth rate of -3.3%, an improvement from the -5.3% rate in the preceding September. Despite this, housing market activity remains weak, with lower mortgage approvals and affordability challenges.
Robert Gardner, Nationwide’s Chief Economist outlined that…
“The uptick in house prices in October most likely reflects the fact that the supply of properties on the market is constrained. There is little sign of forced selling, which would exert downward pressure on prices, as labour market conditions are solid and mortgage arrears are at historically low levels”

Nationwide House Price Methodology
The Nationwide House Price Index, a widely referenced indicator for UK property prices, has several notable limitations. First, it might not offer a complete representation of the entire housing market, as it relies on the lender’s own mortgage data, potentially skewing results towards specific property types and borrowers. There can be a time lag in reporting, impacting the index’s responsiveness to rapid market changes.
The methodology, data source, and seasonal adjustments can introduce subjectivity and potential bias. This makes it essential to consider these factors when interpreting the index’s findings. While the Nationwide House Price Index is a valuable tool, Nationwide may be inadvertently providing a distorted view of the UK Housing Market.
Moreover, the language around the house price index, may also lead readers to believe that house prices are not falling. When in reality there is a clear trend. However, it may be the case that lower transactional volumes, weighted towards the more expensive end of the market is distorting the average. Later in this article you will see how raw house price data compares to the Nationwide House Price Index.
Read: New Evidence: Faster Deterioration Of The Housing Market Expected
Factors That May Distort The Nationwide House Price Index
The Nationwide House Price index is based on a specific methodology to ensure that it accurately captures the underlying trend in house prices and controls for variations in the mix of properties being sold. Here’s how the raw data is manipulated to produce the index:
- Market Coverage: The Nationwide House Price Index focuses on owner-occupier house purchase transactions involving a mortgage. It does not include buy-to-let and cash purchases. However, as we know, the buy-to-let market is in serious trouble right now.
- Calculation of a ‘Typical’ House Price: The Nationwide HPI uses a set of characteristics that describe the ‘typical’ UK house to track changes in its value over time. This ‘typical house’ is an average across all the characteristics included in the model, calculated using hedonic regression.
- Mix Adjustment: A mix-adjusted or ‘standardized’ index is used to account for changes in the relative weight of each characteristic of a property. Mix adjustment aim to give a consistent weight to each characteristic of a property in the Index. For example, location, type of property, number of bedrooms.
- Data Source, Cleaning, and Sample Size: Nationwide mortgage data is cleaned to include only owner-occupied properties. The Nationwide HPI will ‘exclude properties that do not represent the typical market’. The sample size used for calculations varies depending on the monthly mortgage activity and how many cases meet the data cleaning criteria.
- Seasonal Adjustment: House prices are slightly seasonal, with prices tending to be higher in certain times of the year. To remove this effect, Nationwide produces a seasonally adjusted series for UK house prices. This allows for a clearer view of the overall price trend.
- Updates to Typical House and Data Revisions: The characteristics used to calculate the ‘typical’ house are periodically updated to ensure the index reflects current market conditions.
Nationwide House Price Index Unconscious Bias
The Nationwide House Price Index methodology aims to offer a trustworthy and inclusive gauge of housing price trends in the UK. With a focus on accurately capturing shifts in property values. Nevertheless, the Index’s reliability may be influenced by Nationwide’s discretion in determining the characteristics of a “typical” property. For example, Nationwide exclude data that they deem not meeting certain criteria.
Nationwide also reserves the right to make changes to its methodology or discontinue parts of the index as needed for regulatory or other reasons. Methodology changes are subject to scrutiny by Nationwide’s internal oversight function. The flexibility for Nationwide to modify the methodology when needed raises concerns about potential alignment with their own interests.. This may possibly even unintentionally, given their role as a mortgage provider.
Read: The House Market Crash Is Much Worse Than It Seems Right Now
UK Residential Transactional Volumes Are The Precursor UK House Price Falls
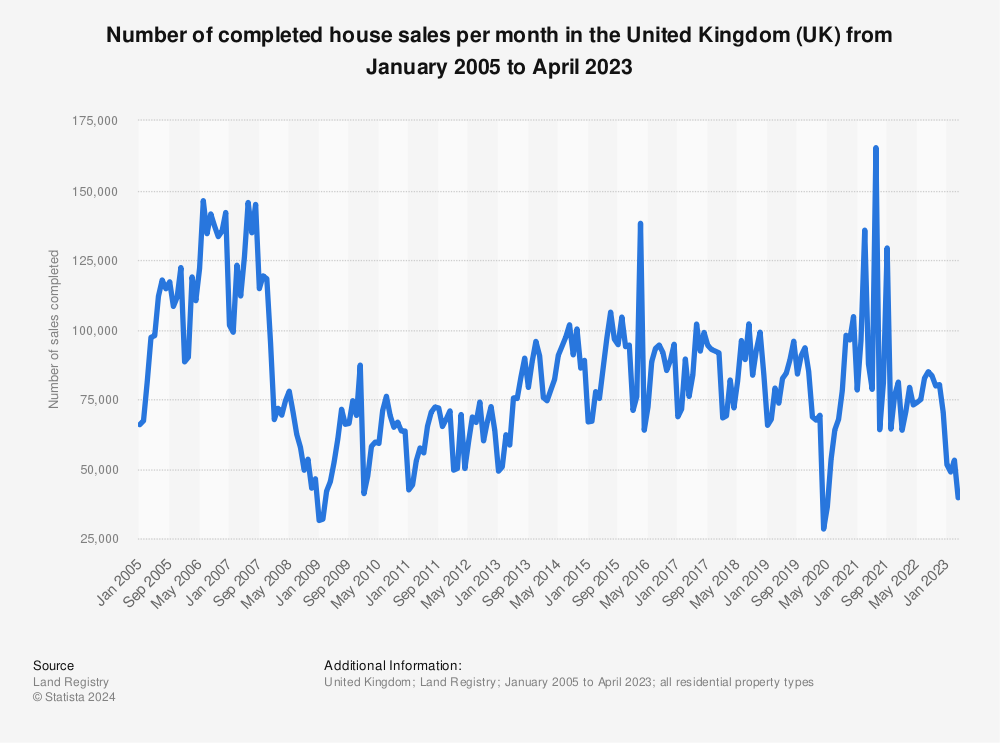
According the UK Government, the provisional non-seasonally adjusted estimate of the number of UK residential transactions in September 2023 is 92,600, 19% lower than September 2022 and 2% lower than August 2023. Seasonally adjusted this estimate falls to 85,610, 17% lower than September 2022. You can see below, the significant downward trend on housing transactions that started around January 2023, and fell into a nose dive.
Find more statistics at Statista
The Great Downsizing And UK House Price Falls
According to Hamptons, “downsizers are taking centre stage in the 2023 housing market”. Recent trends in the housing market have shown a significant resurgence in downsizing, as more and more homeowners opt for properties with fewer bedrooms. Hamptons data reveals that 41% of movers are reducing their bedroom count, a considerable increase from 32% in 2022 and 33% in 2019. This spike is the highest since Hamptons started tracking 2016.
The data reflects that 59% of downsizing moves resulted in one fewer bedroom, compared to 64% in 2022. Meanwhile, the number of those dropping two bedrooms rose from 26% to 28% and those giving up three or more bedrooms increased from 10% to 13%. This is evidence that homeowners are selling the offset the cost of energy bills and interest rate rises.
The fact that higher value properties are selling will likely distort the average property price in England. As a higher weighting of more expensive properties in house price indices will distort the average UK house price. Therefore, just because the average house price is seemingly stable, it does not mean house prices are not falling.
Read: 5 Reasons House Prices Will Keep Falling In The UK
Land Registry Raw House Price Data vs Nationwide House Price Index
According to Moving Home with Charlie, the House Prices have fallen -12.6% already according to raw Land Registry data. Which would mean that the Nationwide House Price Index is very distorted. As the raw Land Registry data showing average house falls to September 2023 on a year-on-year basis.
- 16% for Flats
- 19.6% for terraced houses
- 6% for semi-detached houses
- 14.2% for detached houses
This data also shows semi-detached houses are most in demand, with all other property types falling in price twice or three times faster. This is covered in detail in the Youtube video below.
Conclusion: The Nationwide House Price Index Is Misleading
The Nationwide house price index reported a 0.9% increase in house prices. We must be careful to remember that this is the average house price and not all house prices. Falling transactional volumes and downsizing, may distort the average house price in England. As a result, the Nationwide Index may also be distorted. This seems to be the case, when you compare the Nationwide HPI with the raw Land Registry data; the latter reports reports annual falls of 12.6% vs Nationwide’s HPI of -3.3%.
Despite this reported uptick in prices, the housing market activity remains weak, with mortgage approvals for house purchases significantly lower than in previous years, and affordability issues persisting. There is no escaping macro-economics and the housing market has out-run It for far too long. The challenges that continue to plague the real estate landscape won’t fade anytime soon.
Want to know more about house prices falls in England and Wales? Click here toreveal the map showcasing where house prices are fallingin your local area and stay ahead of the real estate trends with our exclusive insights!
Explore exclusive offers below. Limited time. Act now!
Take a moment to explore the offers below. These opportunities won’t stick around for long, so why not check them out?
Join me and invest with Freetrade. Get started with a free share worth £10 to £100. The probability is weighted, so more expensive shares will be rarer. T&Cs apply. Capital at risk.
Join me and invest with Wombat Invest. Get £10 in cash when you join Wombat with my exclusive affiliate link. Capital at risk.
Learn more about investing and get the 8 Index Funds that make my shortlist.
Open or transfer a SIPP with Moneyfarm to enter the £20,000 prize draw. Capital at risk.
Start investing with the Lightyear App and earn up to 4.50% interest earned on uninvested cash. Capital at risk.


